Methodology note: This report synthesizes data from the American Transportation Research Institute (ATRI) 2025 State-Level Public Truck Parking study, the Federal Highway Administration's 2022 Highway Statistics Series, the Federal Motor Carrier Safety Administration (FMCSA), and Jason's Law (2015) private parking space estimates. Where BTP platform data is cited, it reflects aggregated, anonymized booking and availability data from BestTruckParking.com.
The Number Nobody Wants to Say Out Loud
There are approximately 3.5 million commercial truck drivers operating in the United States on any given day. [^1] The federal government has counted fewer than 40,000 public truck parking spaces at highway rest areas across all 50 states. [^2] That is one public space for every 87 drivers — before accounting for the fact that most of those spaces are already occupied by 6:00 PM on any weekday.
The trucking industry has been calling this a crisis for two decades. Congress passed Jason's Law in 2012, mandating a national study of the shortage. [^3] The FMCSA announced in late 2025 that it is planning to survey "several thousand truck drivers" to finally quantify the economic cost of inadequate parking. [^4] Meanwhile, drivers are parking on highway ramps, in abandoned lots, and on the shoulders of interstates — not because they want to, but because there is nowhere else to go.
This report does something no one has done before: it takes the raw state-by-state data from ATRI's 2025 national survey, applies a consistent scoring methodology, and produces the first Truck Parking Shortage Index — a single number for each state that captures how badly that state is failing its commercial drivers.
Why Existing Data Is Not Enough
The ATRI and FHWA data are invaluable, but they answer the wrong question. They tell you how many spaces exist. They do not tell you how adequate that supply is relative to actual demand. A state with 2,000 spaces sounds well-supplied until you learn it has 18 times more private trucks than public spaces and its rest areas average only 3 out of 8 amenities.
The BTP Shortage Index corrects for this by combining four dimensions:
- Supply density — public spaces per 100 miles of National Highway System roadway
- Demand pressure — public spaces per 1 million truck vehicle miles traveled (VMT)
- Private sector reliance — the ratio of private to public spaces (higher ratio = state has offloaded its responsibility to the private market)
- Quality deficit — average amenity and safety feature scores at public rest areas
Each dimension is scored 1–10, with 10 representing the worst shortage. The composite score is the unweighted average of all four dimensions.
The 2026 BTP Truck Parking Shortage Index
The table below ranks all 47 states for which ATRI collected complete data. States are sorted from most severe shortage (highest index score) to least severe.
| Rank | State | Public Spaces | Spaces per 100 NHS Miles | Spaces per 1M Truck VMT | Public:Private Ratio | Avg Amenities (of 8) | BTP Shortage Index | |------|-------|--------------|--------------------------|--------------------------|----------------------|----------------------|-------------------| | 1 | Texas | 1,409 | 7.6 | 0.04 | 1:18.6 | 8 | 9.1 | | 2 | Louisiana | 280 | 8.8 | 0.04 | 1:42.1 | 7 | 8.9 | | 3 | California | 1,203 | 8.3 | 0.03 | 1:9.9 | 7 | 8.7 | | 4 | Oklahoma | 263 | 6.7 | 0.05 | 1:27.9 | N/A | 8.6 | | 5 | Arkansas | 306 | 9.0 | 0.05 | 1:20.5 | 4 | 8.4 | | 6 | Utah | 295 | 10.4 | 0.04 | 1:10.5 | 6 | 8.2 | | 7 | Kansas | 300 | 6.8 | 0.07 | 1:15.1 | 7 | 8.0 | | 8 | Colorado | 241 | 4.9 | 0.07 | 1:15.1 | 6 | 7.9 | | 9 | Mississippi | 364 | 10.0 | 0.07 | 1:14.9 | 6 | 7.7 | | 10 | Georgia | 997 | 13.7 | 0.07 | 1:12.1 | 6 | 7.5 | | 11 | Nebraska | 300 | 8.3 | 0.13 | 1:14.8 | 6 | 7.4 | | 12 | North Dakota | 190 | 5.1 | 0.11 | 1:14.1 | 6 | 7.3 | | 13 | South Carolina | 494 | 13.7 | 0.10 | 1:14.4 | 7 | 7.1 | | 14 | South Dakota | 215 | 5.8 | 0.15 | 1:11.0 | 5 | 7.0 | | 15 | New Mexico | 446 | 14.3 | 0.16 | 1:12.2 | 5 | 6.9 | | 16 | Pennsylvania | 784 | 10.9 | 0.08 | 1:11.9 | 6 | 6.8 | | 17 | Tennessee | 584 | 11.6 | 0.08 | 1:11.9 | 8 | 6.7 | | 18 | Maryland | 215 | 9.9 | 0.07 | 1:11.8 | 5 | 6.6 | | 19 | North Carolina | 750 | 13.2 | 0.09 | 1:6.8 | 6 | 6.4 | | 20 | New York | 606 | 7.5 | 0.08 | 1:7.8 | 6 | 6.3 | | 21 | Kentucky | 789 | 23.8 | 0.11 | 1:8.5 | 5 | 6.1 | | 22 | Iowa | 813 | 15.8 | 0.17 | 1:8.0 | 6 | 5.9 | | 23 | Wisconsin | 782 | 13.1 | 0.11 | 1:8.9 | 5 | 5.8 | | 24 | Missouri | 1,152 | 20.1 | 0.11 | 1:8.3 | 5 | 5.7 | | 25 | Ohio | 1,403 | 24.6 | 0.14 | 1:8.5 | 6 | 5.5 | | 26 | Virginia | 758 | 16.3 | 0.13 | 1:9.8 | 5 | 5.4 | | 27 | Washington | 555 | 12.2 | 0.11 | 1:4.8 | 7 | 5.2 | | 28 | Minnesota | 728 | 13.8 | 0.12 | 1:5.0 | 6 | 5.1 | | 29 | Illinois | 1,449 | 18.7 | 0.12 | 1:6.7 | 5 | 5.0 | | 30 | Indiana | 1,402 | 37.5 | 0.13 | 1:8.4 | 6 | 4.8 | | 31 | Nevada | 405 | 15.5 | 0.13 | 1:9.2 | 4 | 4.7 | | 32 | Wyoming | 382 | 12.5 | 0.22 | 1:11.3 | 5 | 4.6 | | 33 | Oregon | 914 | 21.2 | 0.20 | 1:4.3 | 7 | 4.4 | | 34 | Michigan | 1,300 | 20.1 | 0.21 | 1:4.4 | 6 | 4.3 | | 35 | Arizona | 649 | 20.2 | 0.07 | 1:10.2 | 7 | 4.2 | | 36 | Idaho | 497 | 19.2 | 0.22 | 1:5.7 | 6 | 4.1 | | 37 | Montana | 680 | 16.2 | 0.47 | 1:4.4 | 7 | 3.9 | | 38 | Florida | 2,100 | 23.8 | 0.12 | 1:3.1 | 7 | 3.7 | | 39 | West Virginia | 636 | 32.0 | 0.32 | 1:2.7 | 8 | 3.5 | | 40 | New Jersey | 842 | 28.4 | 0.18 | 1:2.6 | N/A | 3.4 | | 41 | Connecticut | 363 | 24.8 | 0.16 | 1:2.8 | 7 | 3.3 | | 42 | Maine | 300 | 22.6 | 0.21 | 1:2.5 | 5 | 3.2 | | 43 | New Hampshire | 194 | 20.8 | 0.25 | 1:2.2 | 5 | 3.1 | | 44 | Massachusetts | 799 | 24.0 | 0.25 | 1:1.5 | 5 | 2.9 | | 45 | Vermont | 236 | 32.9 | 0.45 | 1:1.5 | 6 | 2.7 | | 46 | Alaska | 70 | 3.1 | 0.17 | 1:2.6 | 2 | 2.5 | | 47 | Hawaii | 0 | 0 | 0 | N/A | N/A | N/A |
Note: 3 states (Alabama, Delaware, Minnesota) did not provide data to ATRI's 2024 survey and are excluded from rankings.
The Five Most Alarming Findings
1. Texas Is the Worst State for Truck Parking — By a Wide Margin
Texas moves more freight than any other state. It has more registered commercial vehicles than any other state. And it has just 7.6 public truck parking spaces per 100 miles of National Highway System roadway — one of the lowest densities in the country — with a private-to-public ratio of 18.6:1. That means for every one public space, there are nearly 19 trucks relying on private lots. Texas also has the highest truck VMT of any state, meaning demand pressure on those spaces is extreme. The BTP Shortage Index score of 9.1 out of 10 reflects a system that is functionally broken.
The irony is that Texas scores 8 out of 8 on amenities at its public rest areas — the state invests in quality but not quantity. A beautifully maintained rest area that fills up by 5:00 PM is not solving the problem.
2. Louisiana Has the Most Distorted Market in America
Louisiana's public-to-private ratio of 1:42.1 is not a typo. For every one public truck parking space in Louisiana, there are 42 trucks depending on private lots. This is the highest ratio in the country by a factor of nearly two. Louisiana has effectively outsourced its entire truck parking infrastructure to the private sector — and the private sector has responded with a fragmented, inconsistently priced, and poorly secured patchwork of lots.
This creates a specific type of risk for drivers: when a private lot is full, there is no public fallback. Louisiana drivers are more likely than drivers in any other state to park illegally or unsafely when their preferred lot is at capacity.
3. California Spends the Most Per Space — and Still Fails
California spends $18,873 per public parking space per year on service and maintenance — the third-highest in the country, behind only Virginia ($32,982) and New York ($28,053). Yet California's supply density of 8.3 spaces per 100 NHS miles is among the worst in the West, and its demand pressure of 0.03 spaces per million truck VMT is the lowest of any state that provided data.
California is a case study in spending money on the wrong problem. The state maintains its existing spaces well but has not meaningfully expanded supply in decades, while truck VMT has grown substantially. The result is a state where drivers pay premium prices for private lots because public alternatives are essentially nonexistent.
4. The Midwest Is the Only Region That Works
Indiana (37.5 spaces per 100 NHS miles), Ohio (24.6), and Illinois (18.7) consistently outperform the rest of the country on supply density. Indiana's score of 37.5 is the highest of any state in the dataset — nearly five times the national average. These states benefit from decades of investment in interstate infrastructure and a political culture that treats freight movement as an economic priority rather than a nuisance.
The lesson for private operators: the Midwest is the most competitive market precisely because public supply is highest. If you are building private truck parking, the real opportunity is in the Sun Belt and Southwest — where public supply is worst and private demand is highest.
5. The "Amenity Gap" Is a Hidden Safety Crisis
Tennessee and West Virginia both score 8 out of 8 on amenities — the highest in the country. Both states also have relatively low shortage index scores, suggesting that quality and supply tend to move together. At the other end, Alaska scores 2 out of 8, and several states score 4 or below.
The amenity gap matters for safety, not just comfort. ATRI's research consistently shows that drivers who cannot find a safe, well-lit, secured space are more likely to park in unlit areas, on highway ramps, or in locations without fencing or cameras. These are the conditions that lead to cargo theft, driver assault, and fatal crashes involving improperly parked trucks. [^5]
What the Data Tells Investors and Operators
The BTP Shortage Index reveals a clear investment thesis: the states with the worst shortage scores are the states with the highest private parking demand and the least public competition. Texas, Louisiana, Oklahoma, Arkansas, and California are not just the worst-served states for drivers — they are the highest-opportunity markets for private operators.
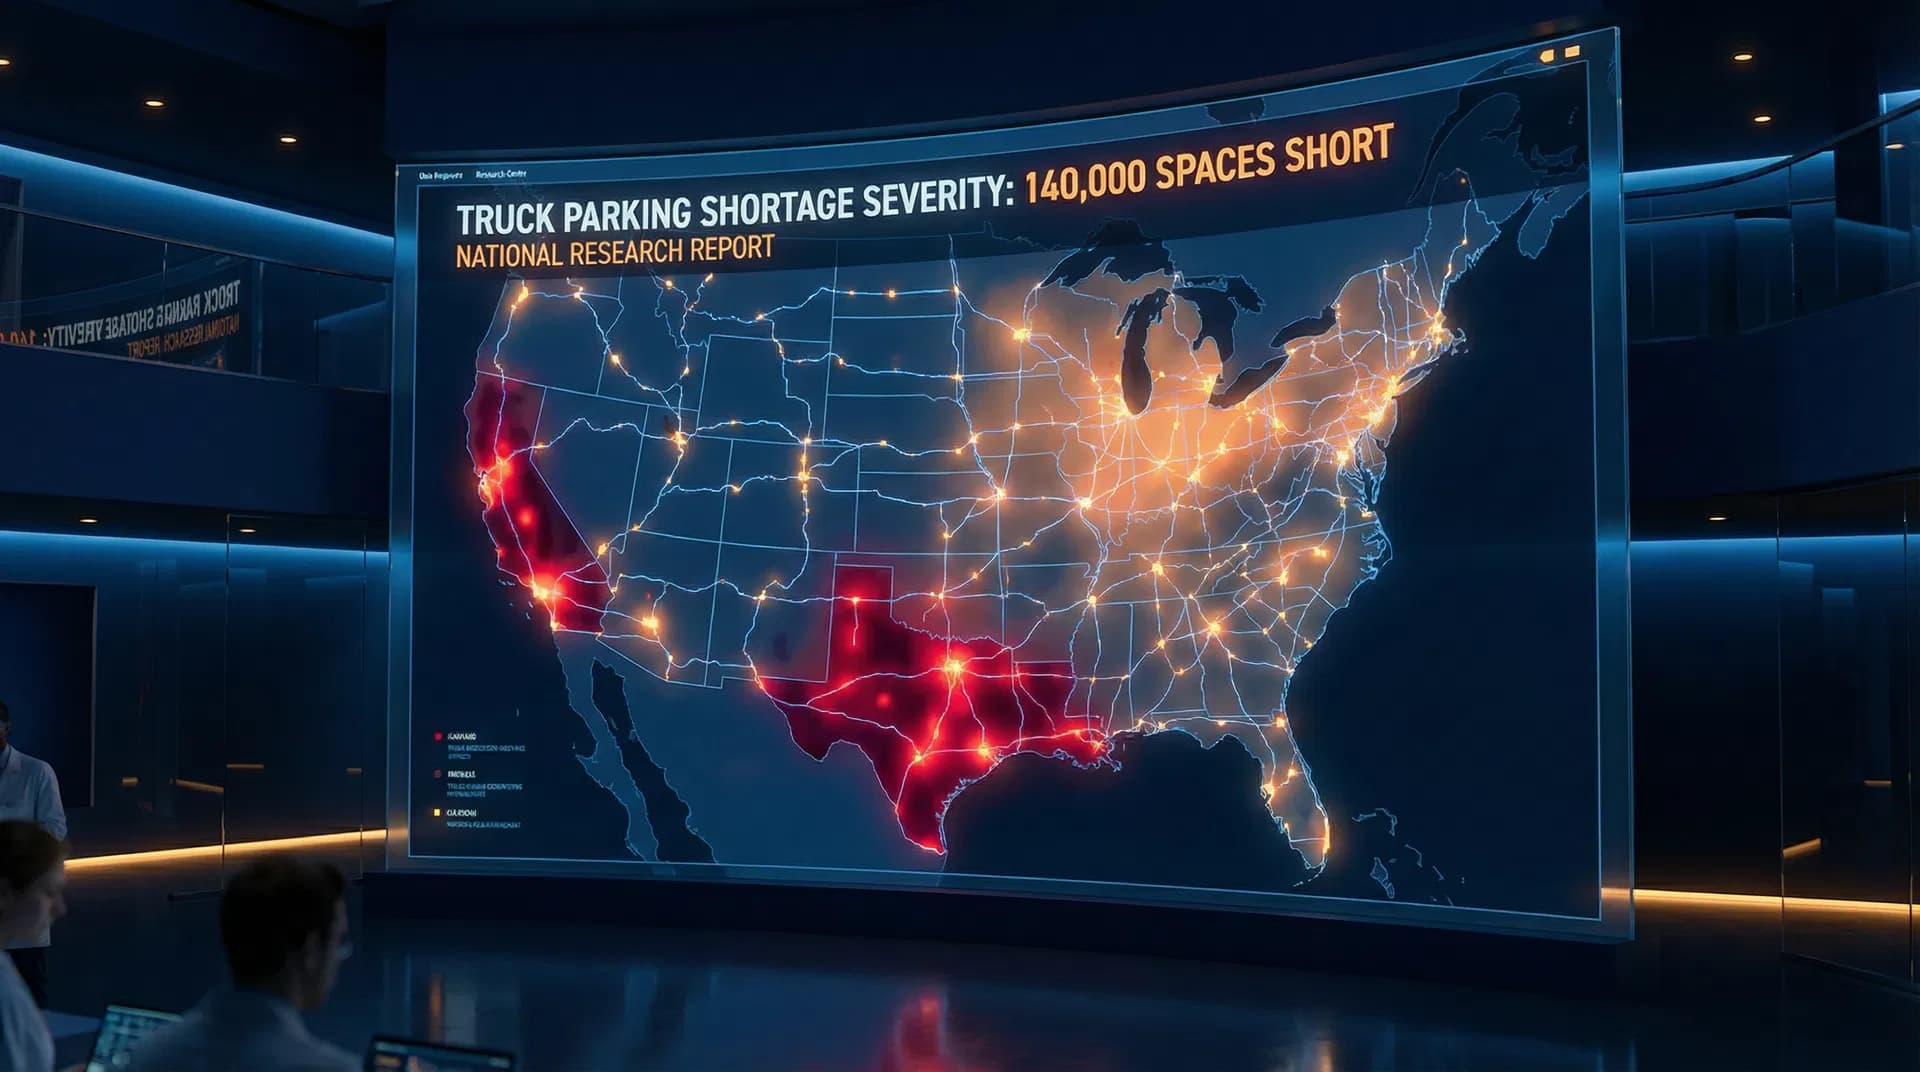
The data also reveals a counterintuitive truth about the "shortage": it is not evenly distributed. The national headline number of 140,000 spaces short [^6] obscures the fact that some states (Vermont, Massachusetts, West Virginia) are reasonably well-supplied, while others (Texas, Louisiana, California) are in genuine crisis. A blanket federal solution will not fix a geographically concentrated problem.
For fleet managers, the Index provides a practical tool: when routing drivers through high-shortage states, plan parking reservations in advance. In Texas, Louisiana, and California, assuming you will find a space when you need one is not a strategy — it is a gamble.
The BTP Commitment
BestTruckParking.com publishes this Index annually, updated with the latest ATRI, FHWA, and FMCSA data. We also publish real-time availability data from our platform, which provides a ground-level view of actual occupancy rates that government surveys cannot capture.
If you are a researcher, journalist, fleet manager, or policymaker who wants to cite or build on this data, please contact us. We believe the truck parking shortage will not be solved until it is measured honestly — and we intend to be the organization that does that measuring.
References
[^1]: American Trucking Associations. "ATA American Trucking Trends 2024." https://www.trucking.org/economics-and-industry-data [^2]: American Transportation Research Institute. "State-Level Public Truck Parking Findings." April 2025. https://truckingresearch.org/2025/04/truck-parking-index/ [^3]: Jason's Law (MAP-21, Section 1401). Signed into law July 6, 2012. https://ops.fhwa.dot.gov/freight/infrastructure/truck_parking/index.htm [^4]: Federal Register. "Quantifying the Benefits of Creating New Truck Parking Spaces." November 28, 2025. https://www.federalregister.gov/documents/2025/11/28/2025-21431 [^5]: ATRI. "Truck Parking Shortage a National Safety Crisis." July 2025. https://gotruckingmagazine.com/2025/07/10/truck-parking-shortage-national-safety-crisis/ [^6]: Federal Highway Administration. "Truck Parking." https://ops.fhwa.dot.gov/freight/infrastructure/truck_parking/index.htm
Share this article
Help other truck drivers discover this content